ggplot(data = courage, aes(x = season, fill = result)) +
geom_bar(position = "fill") +
labs(title = "Distribution of NC Courage game outcomes",
subtitle = "by Season",
y = "Proportion of games") +
scale_fill_viridis_d()
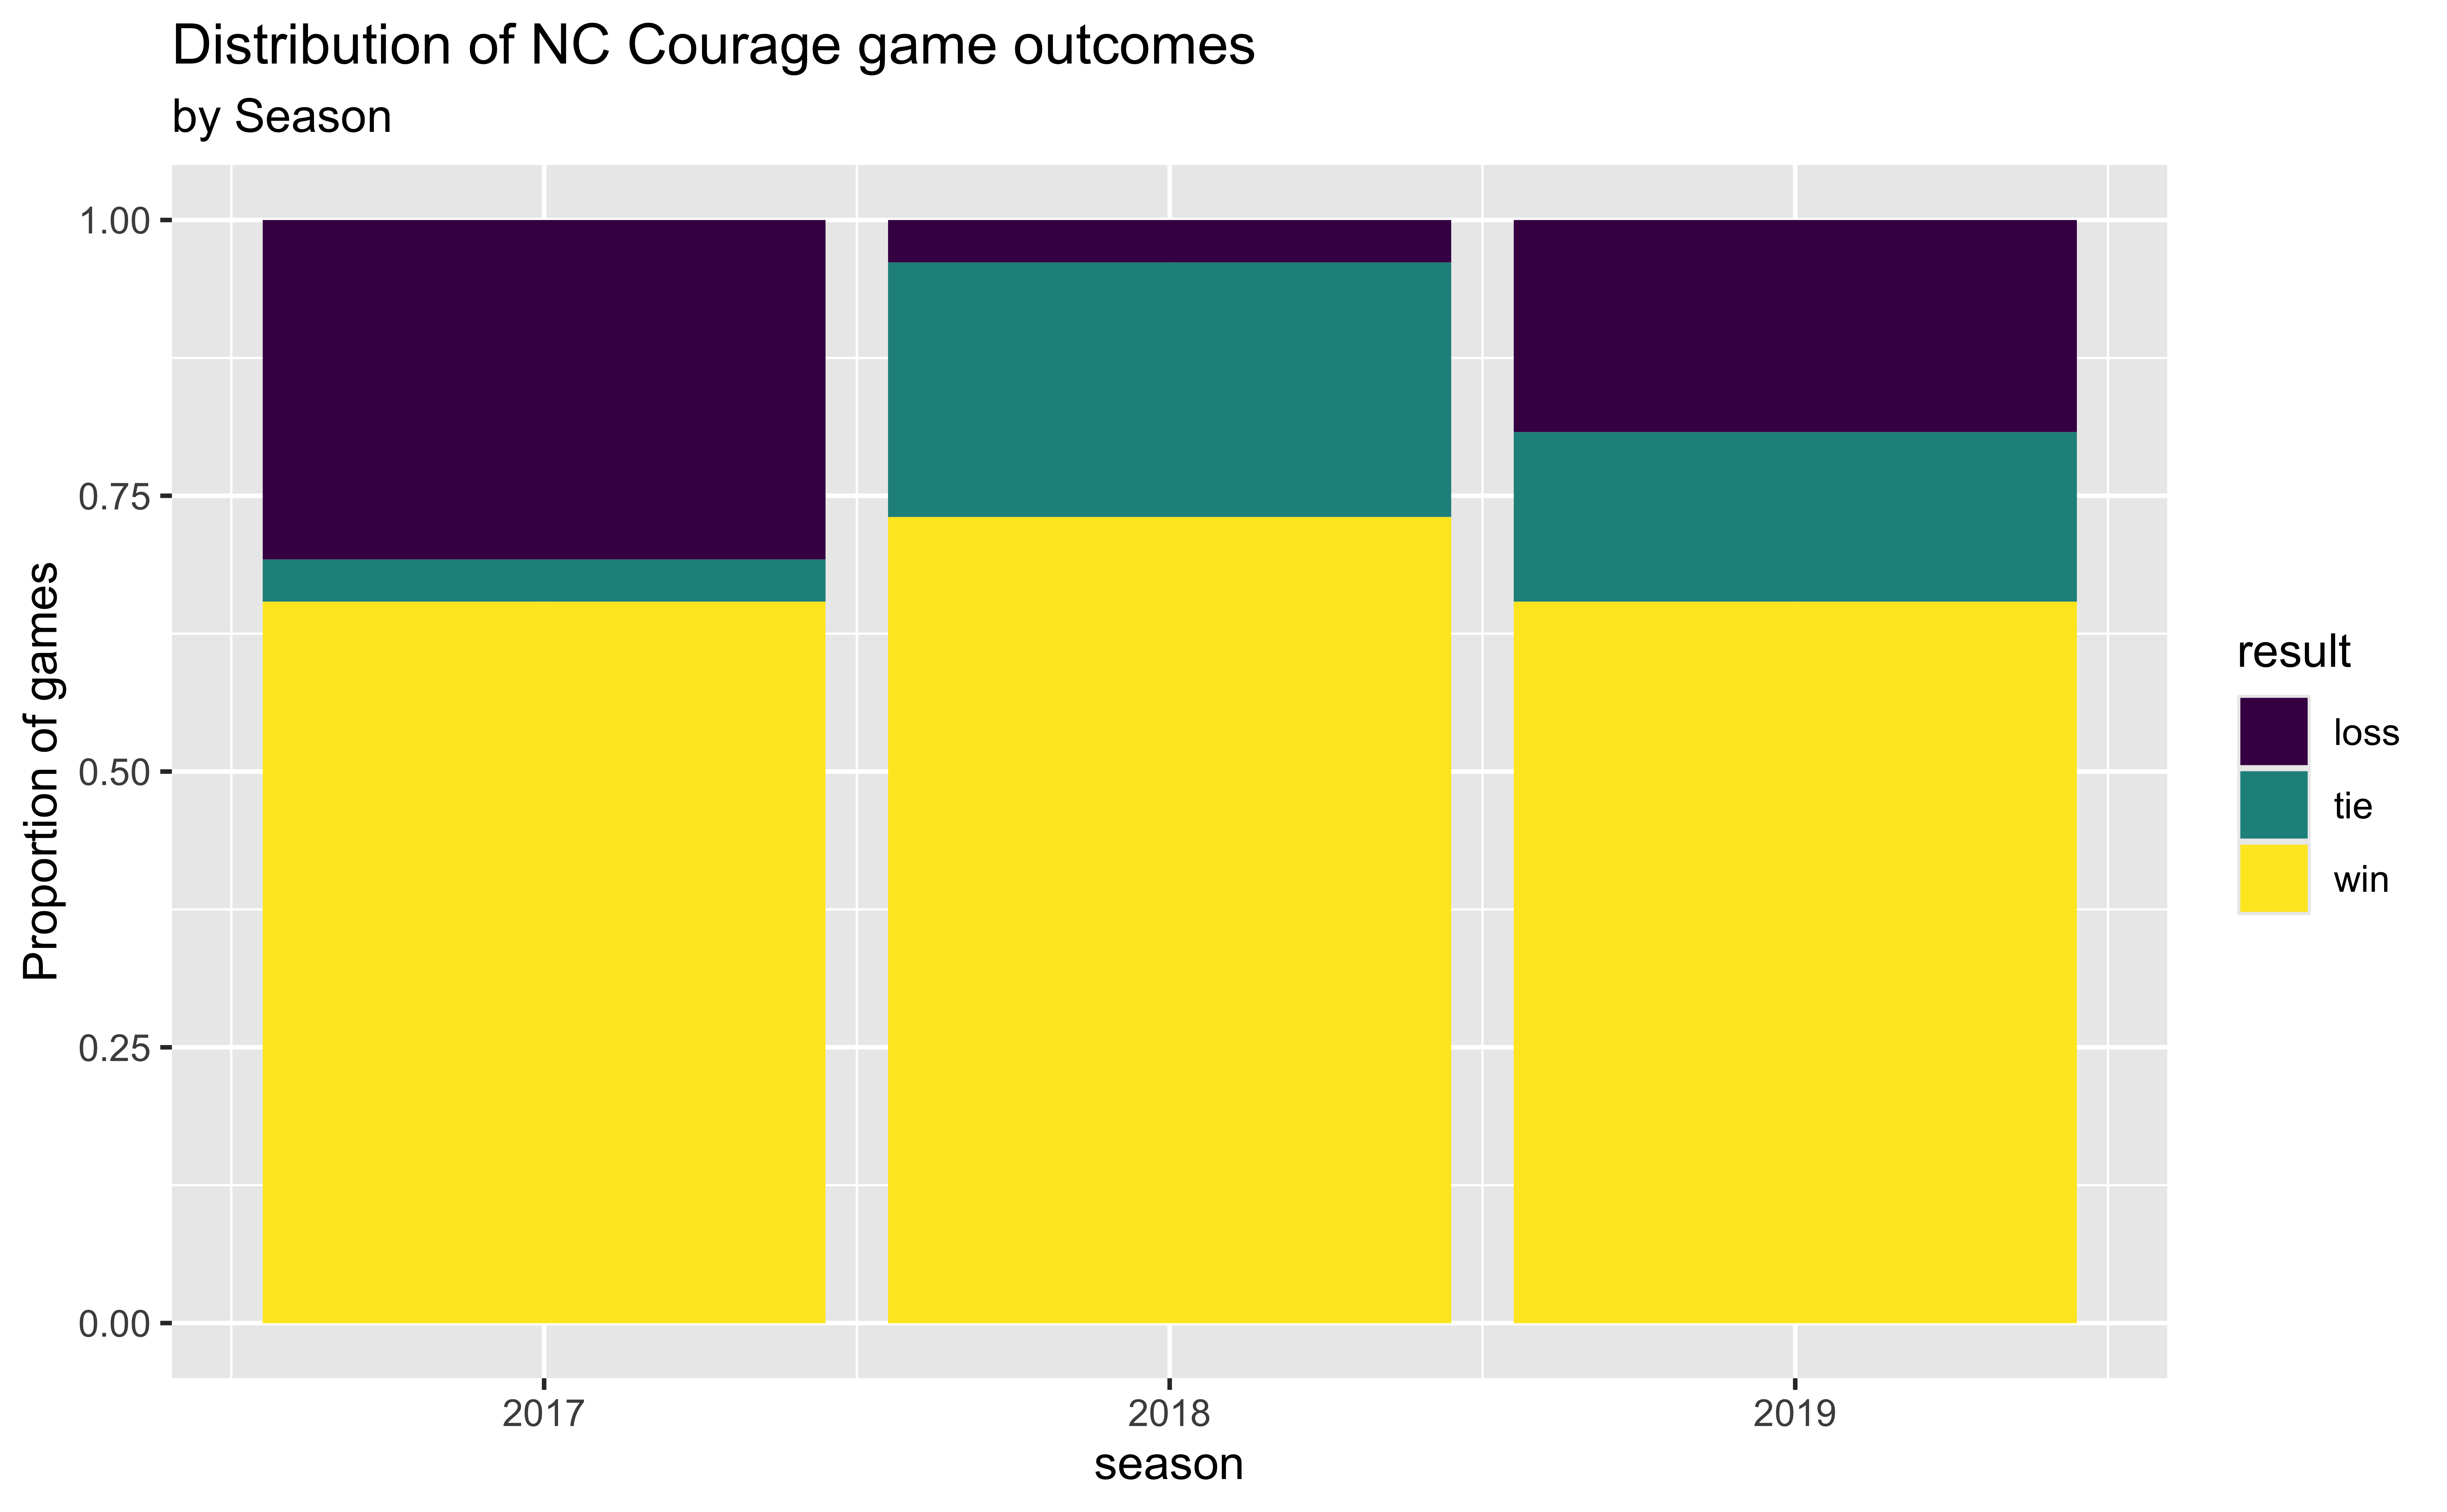
ASA/AMATYC: Introduction to data science technology workshop
July 23, 2024
R \(\hspace{15mm}\) RStudio \(\hspace{15mm}\) Quarto
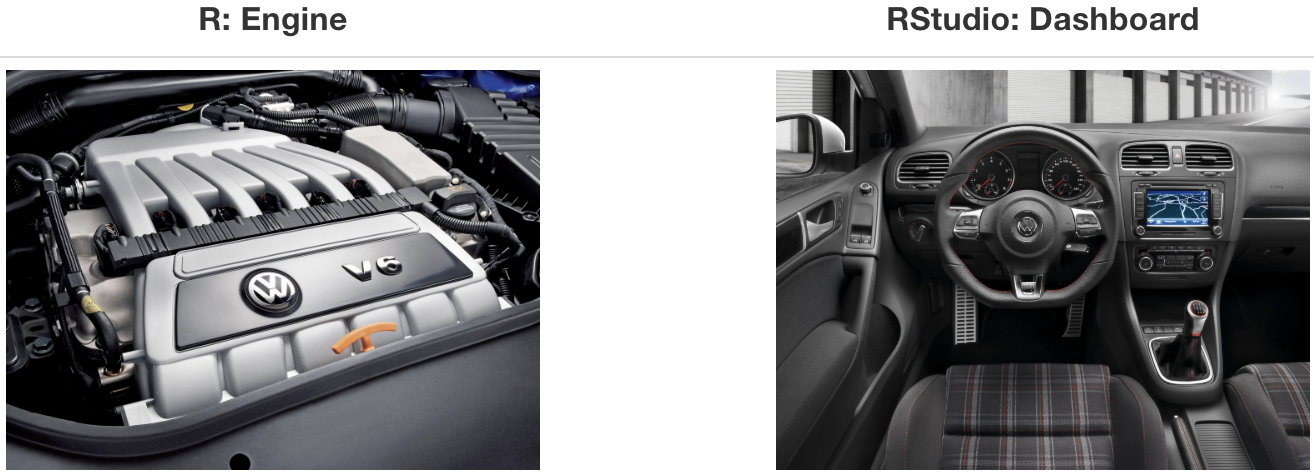
R is a statistical programming language
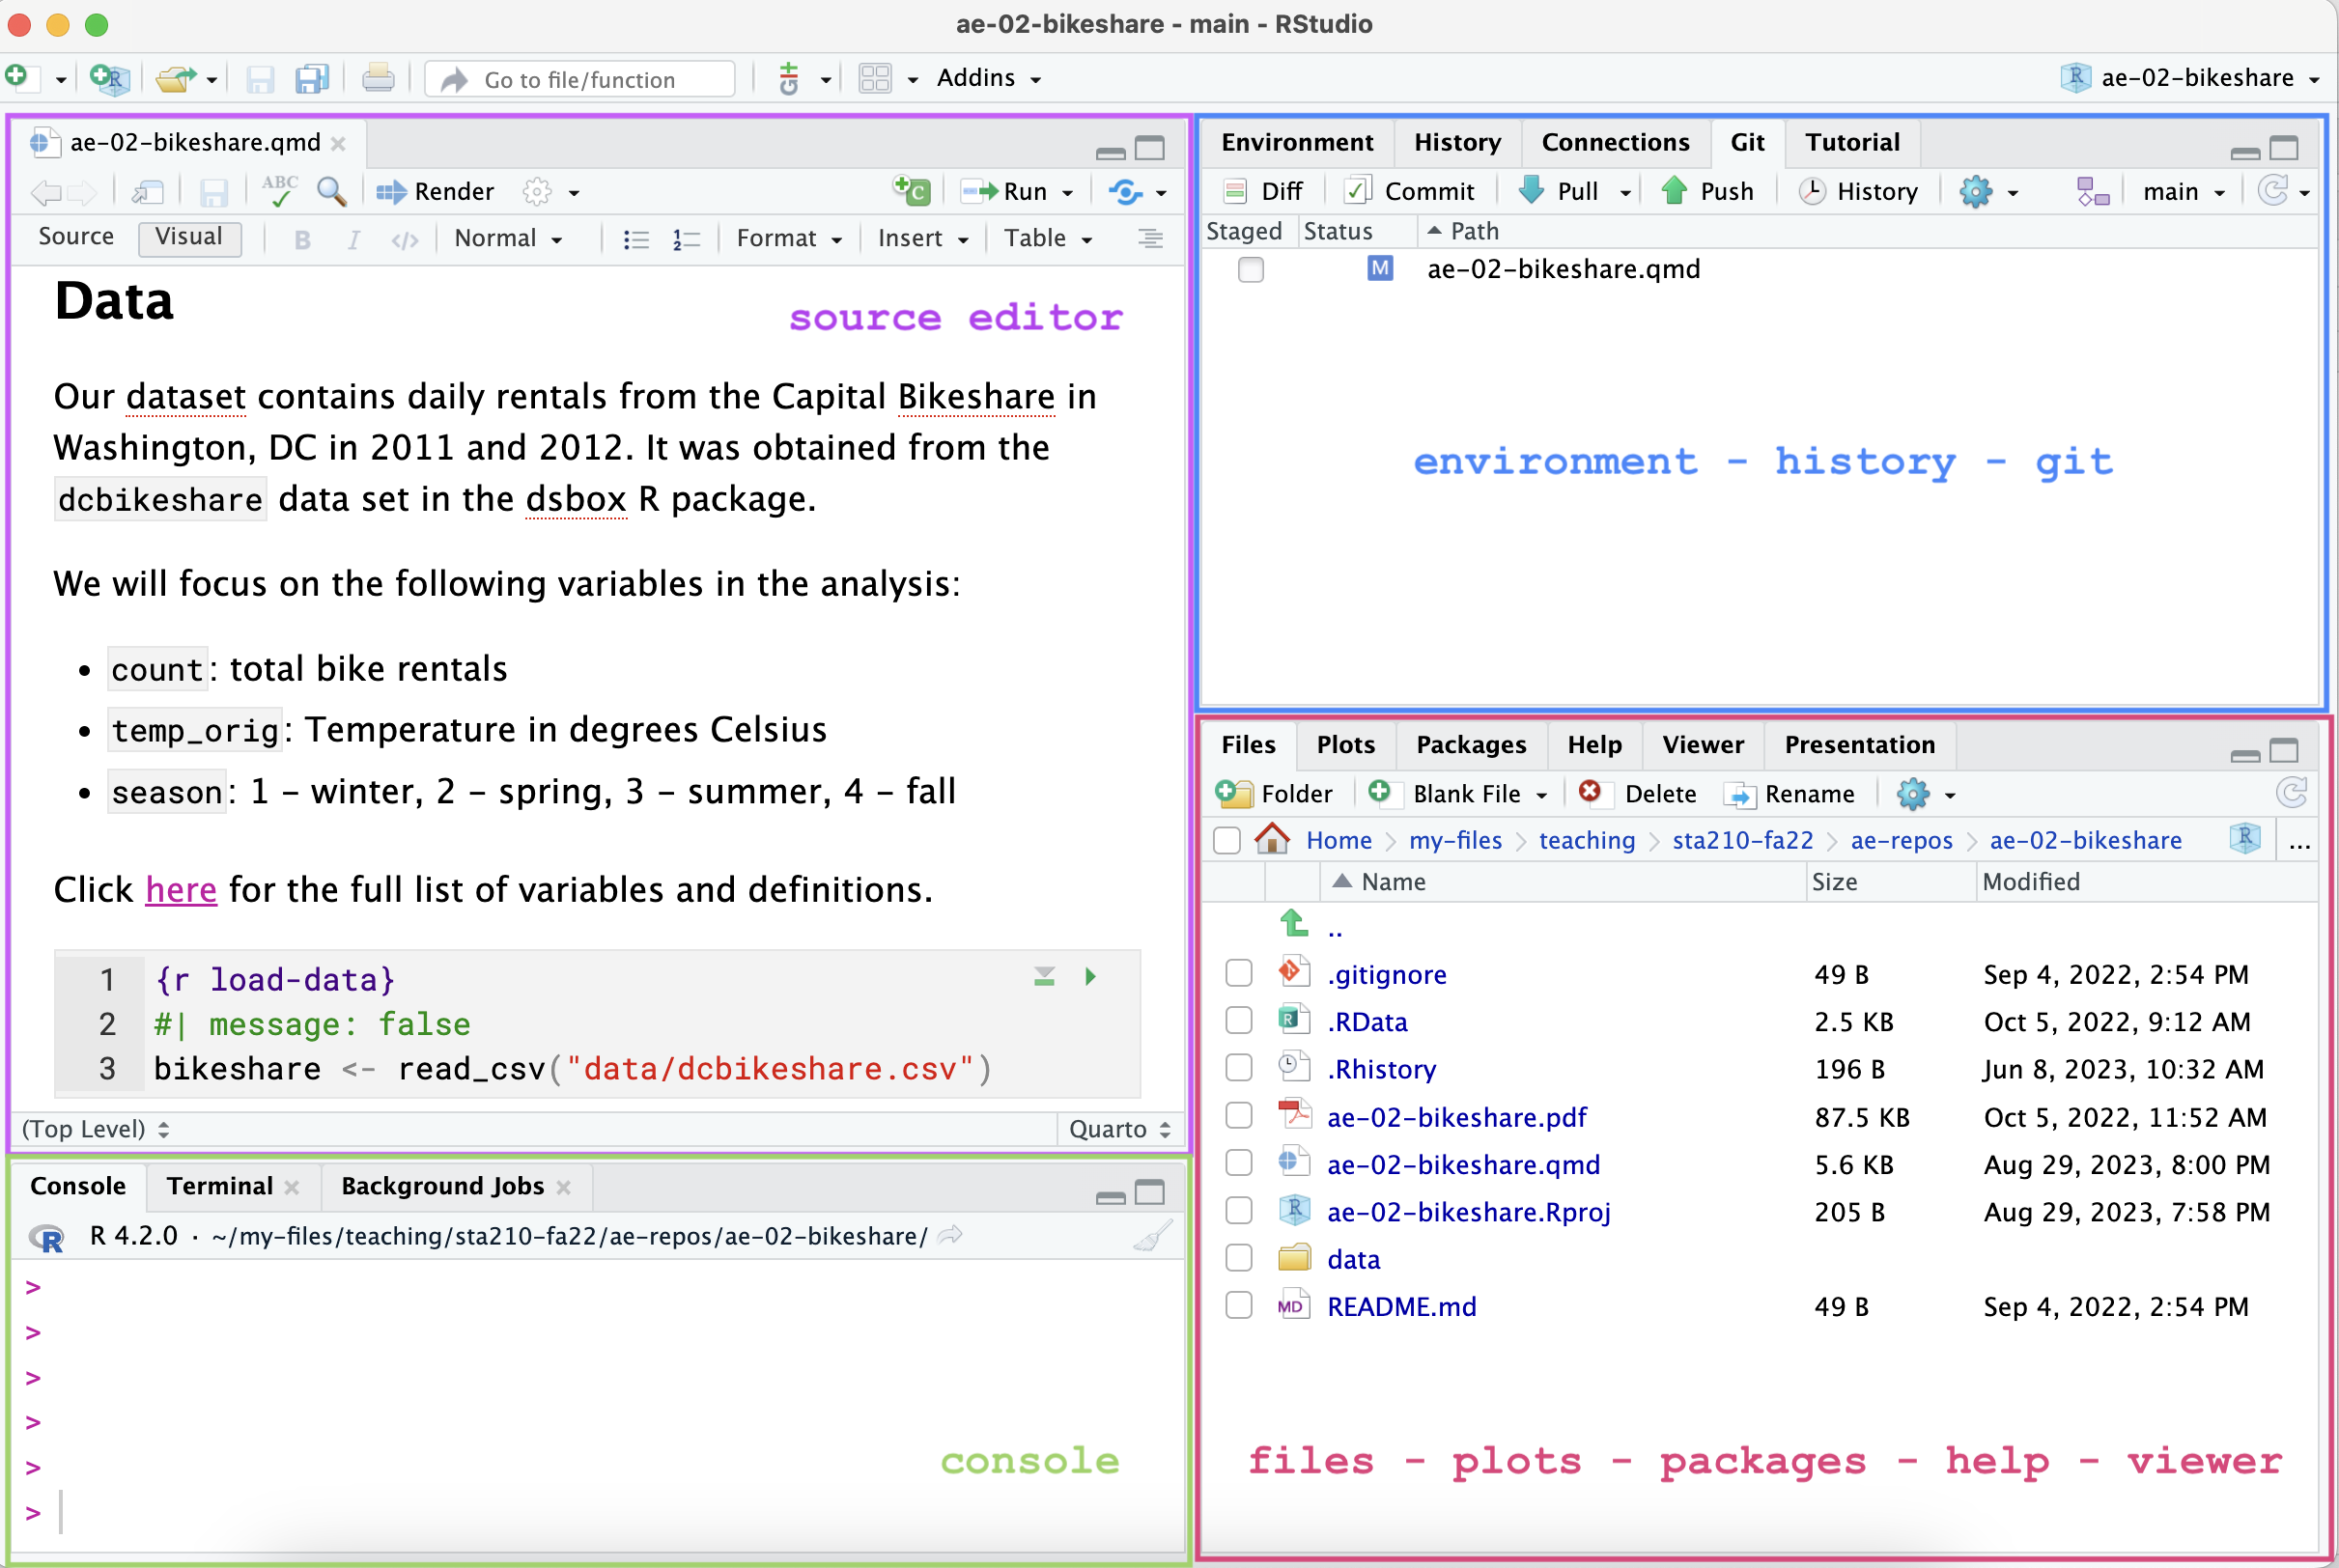
RStudio is a convenient interface for R (an integrated development environment, IDE)
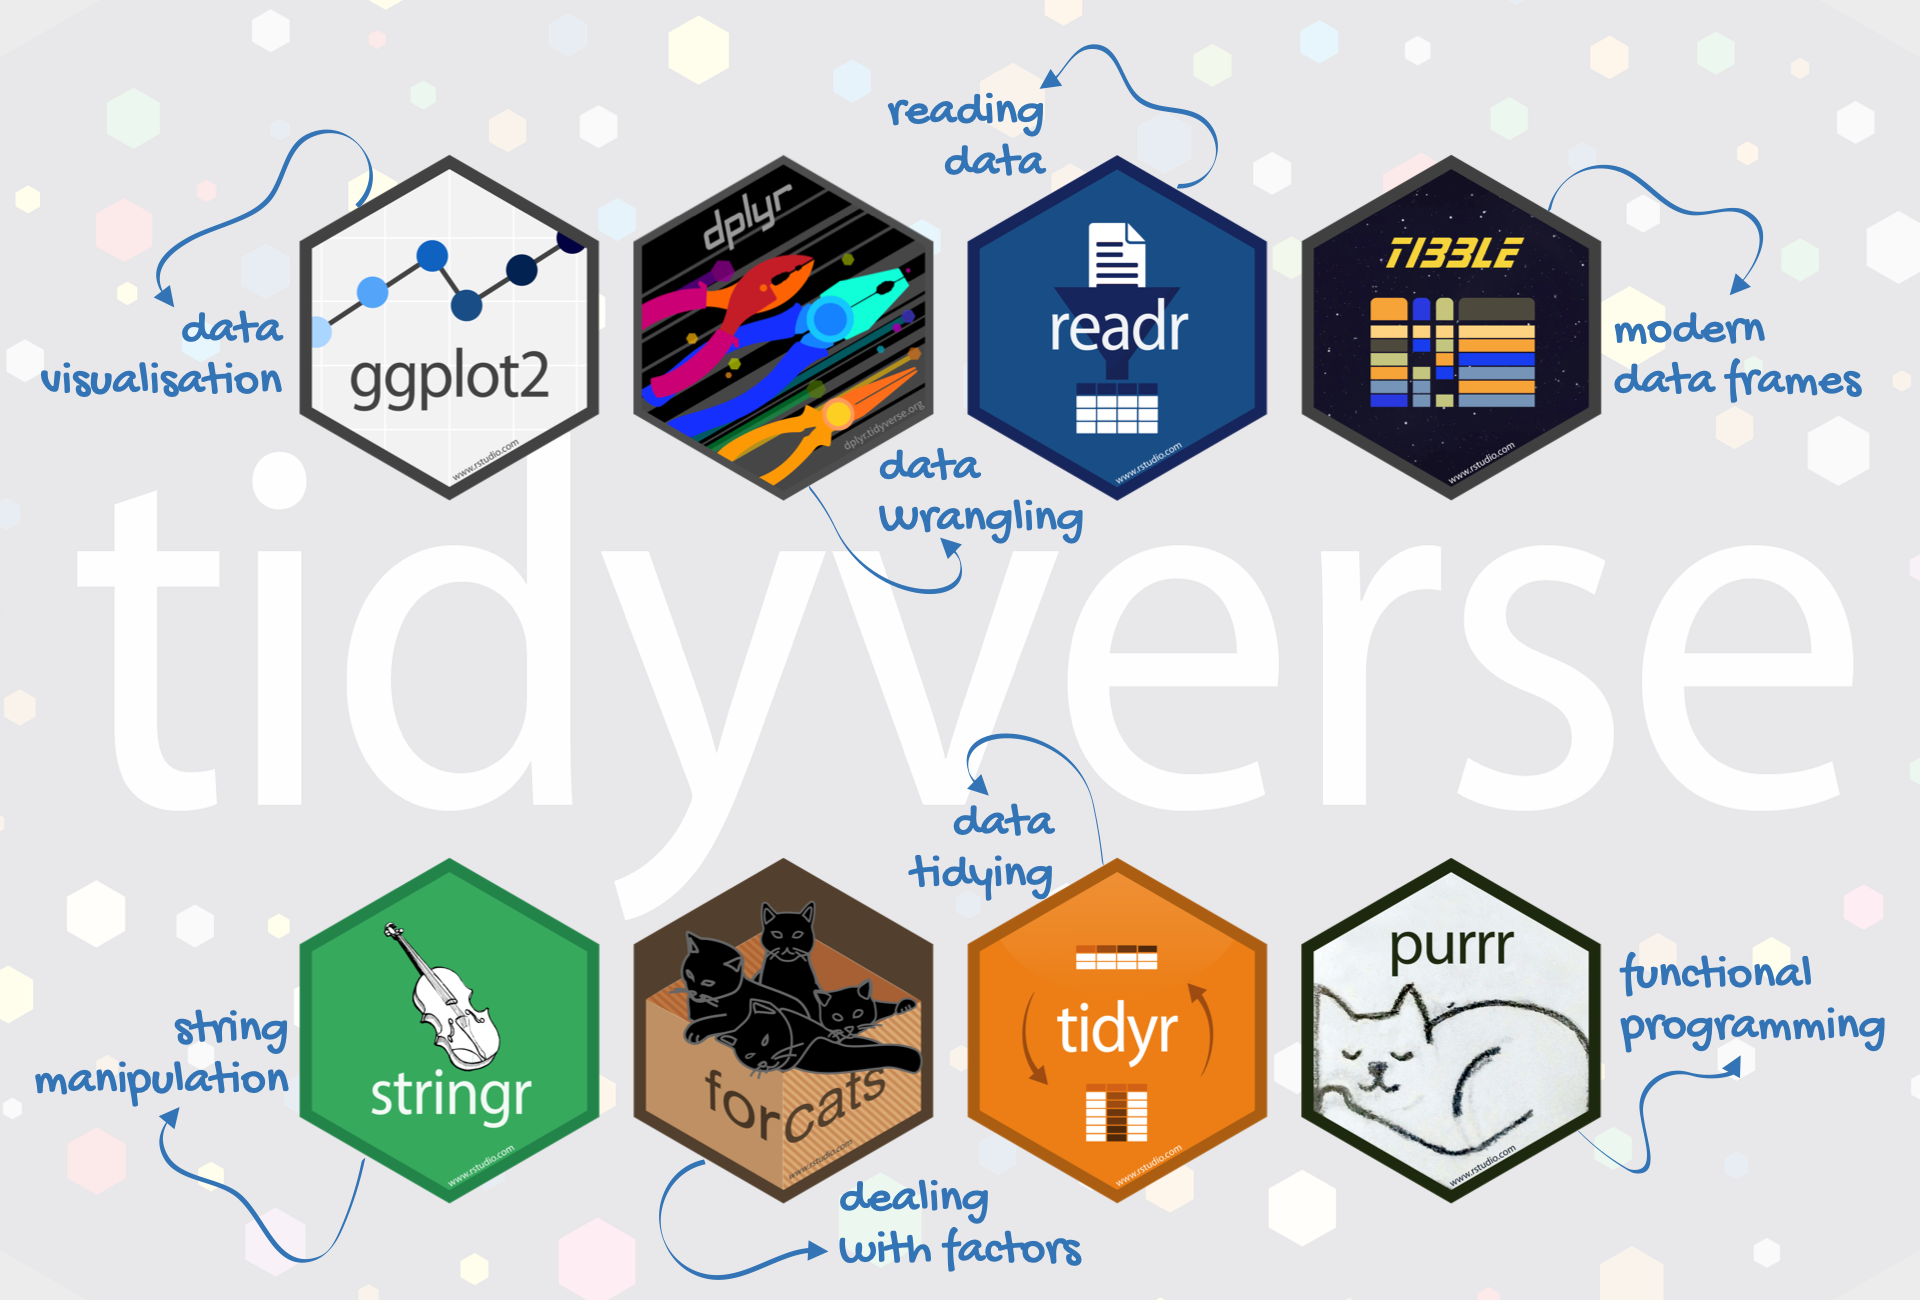
The tidyverse is an opinionated collection of R packages designed for data science. All packages share an underlying design philosophy, grammar, and data structures.
Create a stacked bar plot, showing the distribution of result
within each season
for the NC Courage soccer team.
Calculate the probability a painting contained at least one tree conditioned on whether the painting was created by Bob Ross or a guest painter.
Fit a linear model with height
as the response and sex
and age
as predictors. Display the model output.
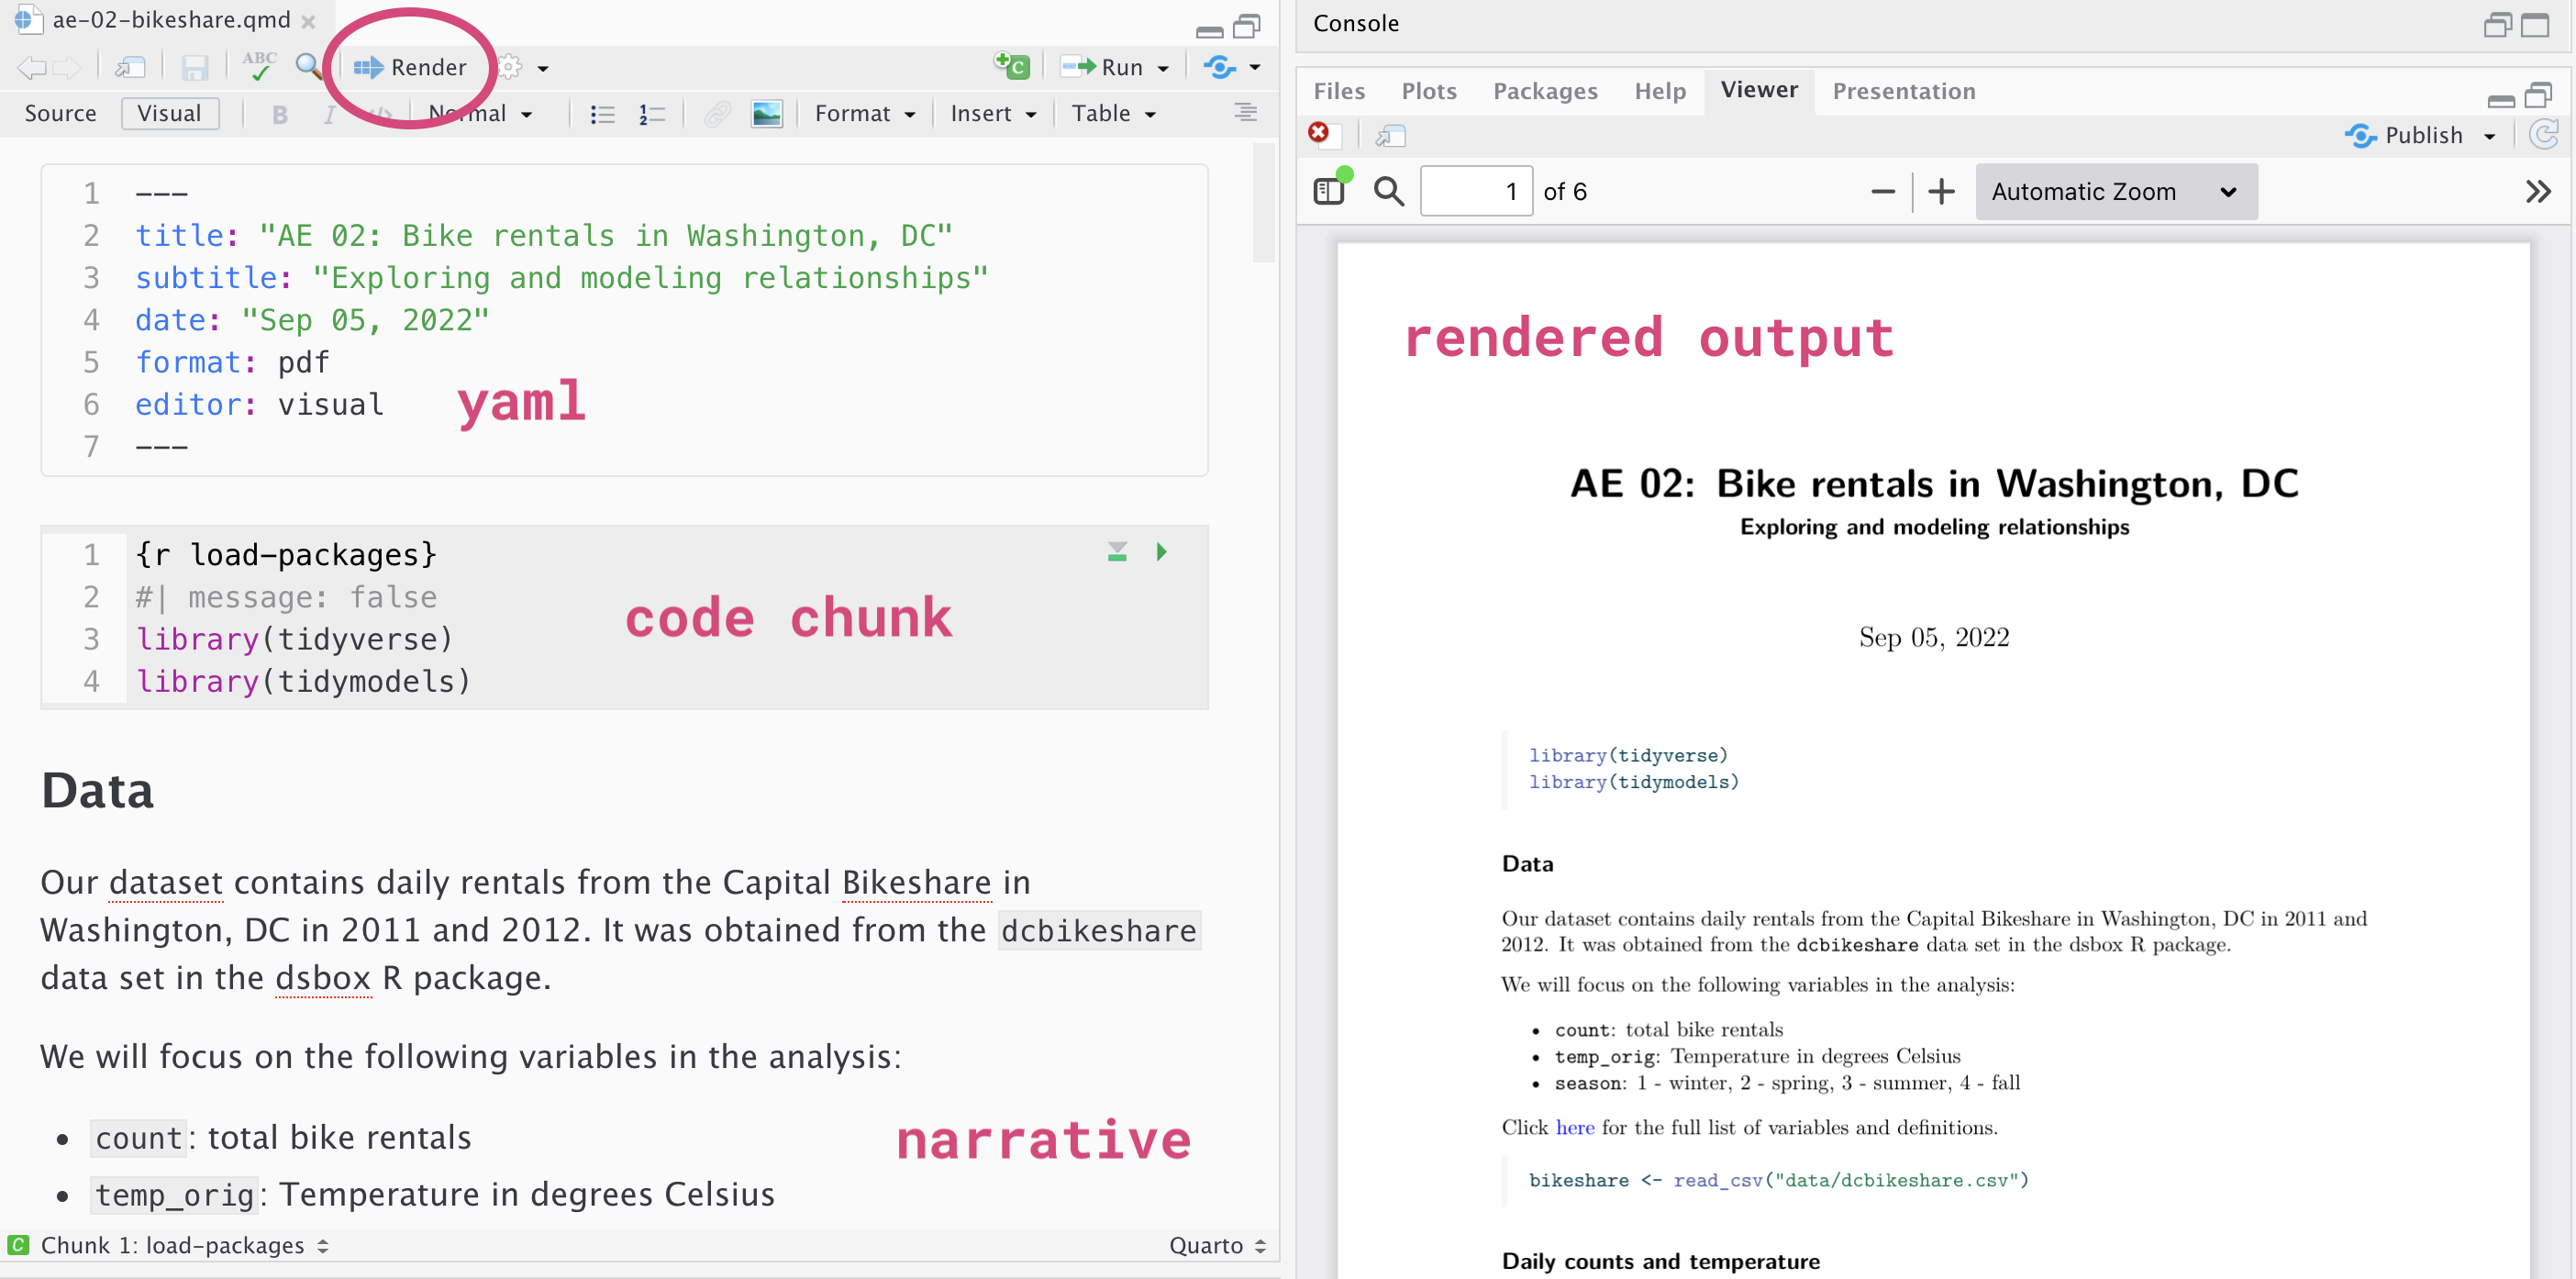
Create fully reproducible reports and other documents
Students install R/ RStudio on a laptop or desktop
Students use R/ RStudio through a web interface1
Centralized RStudio server maintained within the institution
Posit Cloud built and maintained externally by Posit
Students develop computing skills to…
work with complex, messy, and non-standard data
produce professional data science reports and implement best practices for a reproducible workflow
practice data science in academia and industry
Students can access R/ RStudio after the course
Instructors can use R/ RStudio and Quarto to create teaching materials, course websites, books, etc.
R for Data Science (2nd ed): book by Hadley Wickham, Mine Cetinkaya-Rundel, Garret Grolemund
Teaching in the Tidyverse in 2023: blog post by Mine Cetinkaya-Rundel
Teaching (with) Quarto: 2023 Joint Statistical Meeting session
TidyTuesday: weekly data visualization project
Examples in slides: