Introduction
This is an example to show how you can easily write posts for your website using R Markdown!
Load packages
Analysis
We will use the diamonds data set in the ggplot2 package. Let’s take a look at the data!
diamonds %>%
  slice(1:10)
# A tibble: 10 x 10
carat cut color clarity depth table price x y z
<dbl> <ord> <ord> <ord> <dbl> <dbl> <int> <dbl> <dbl> <dbl>
1 0.23 Ideal E SI2 61.5 55 326 3.95 3.98 2.43
2 0.21 Premium E SI1 59.8 61 326 3.89 3.84 2.31
3 0.23 Good E VS1 56.9 65 327 4.05 4.07 2.31
4 0.290 Premium I VS2 62.4 58 334 4.2 4.23 2.63
5 0.31 Good J SI2 63.3 58 335 4.34 4.35 2.75
6 0.24 Very Good J VVS2 62.8 57 336 3.94 3.96 2.48
7 0.24 Very Good I VVS1 62.3 57 336 3.95 3.98 2.47
8 0.26 Very Good H SI1 61.9 55 337 4.07 4.11 2.53
9 0.22 Fair E VS2 65.1 61 337 3.87 3.78 2.49
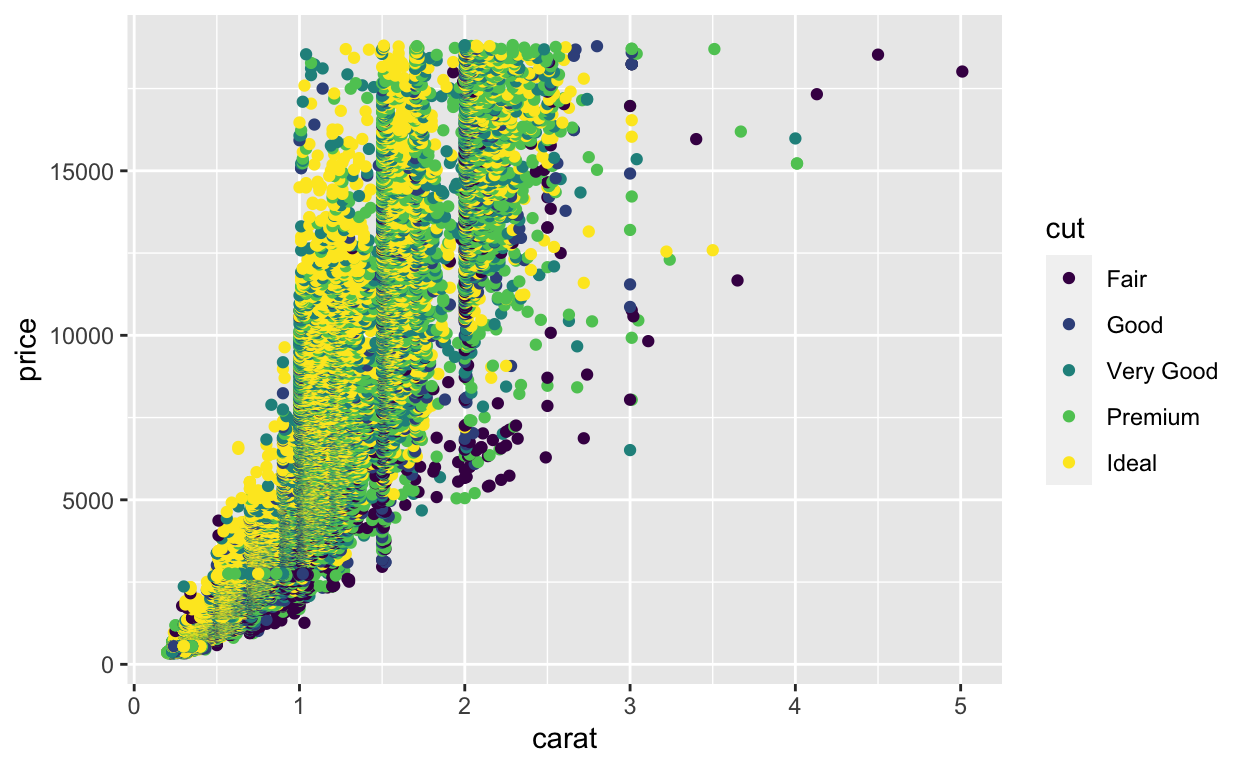
10 0.23 Very Good H VS1 59.4 61 338 4 4.05 2.39Now let’s visualize the data.
ggplot(data = diamonds, aes(x = carat, y = price, color = cut)) +
  geom_point()
Finally, we can fit a regression model predicting the price based on the carat.
| term | estimate | std.error | statistic | p.value |
|---|---|---|---|---|
| (Intercept) | -2256.361 | 13.055 | -172.830 | 0 |
| carat | 7756.426 | 14.067 | 551.408 | 0 |